

How to get started with Google Analytics for WordPress? What does it mean to track visitors? How to install it? And how to start using it?
Google Analytics is a free tool from Google that helps webmasters analyze their site traffic. It provides detailed statistics about the number of visits, pages viewed, time spent on each page, etc. The data collected by Google Analytics allows you to improve your site performance and increase its visibility.
This article explains how to get started with Google analytics for WordPress. This tutorial also covers installation, configuration, and usage.
What is Google Analytics?
Google Analytics is an online service provided by Google Inc. that tracks user behavior across websites. It collects information such as IP address, browser type, operating system, search engine used, referring URL (when available), device type, screen resolution, language settings, etc.
Why use Google Analytics?
Analytics help website owners understand what users do when they visit their sites. It can be used to find out the most popular content, which pages are visited the most often, and other useful information.
How to set up Google Analytics free account
To use this free service, you’ll first need to create an account. Fortunately, to sign up for Google Analytics, all we need is a free Google Account. If you don’t have an account yet, you can open one now to prepare for the analytics.
Google Analytics Sign up
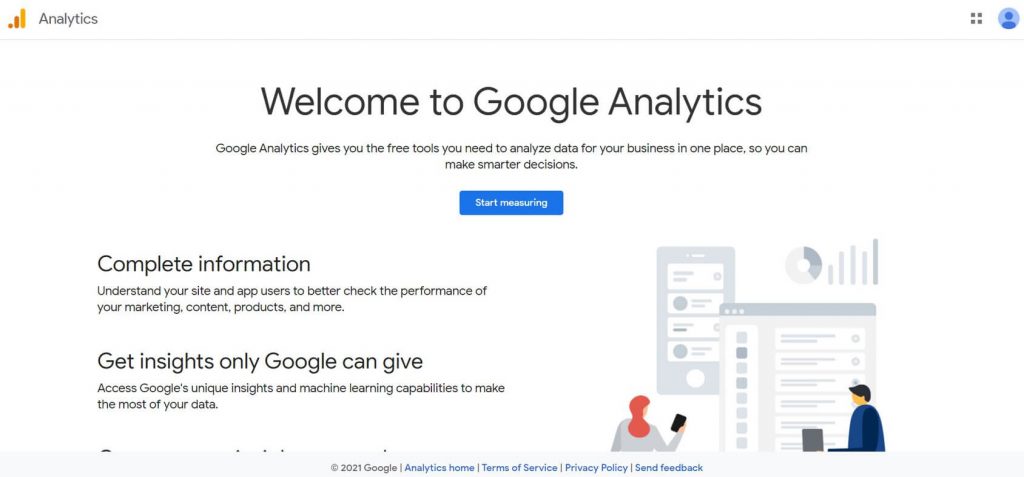
After you’ve created your free Google account, you can open Google Analytics.
- Click on the “Start for Free” button.
- Log in to your Google account.
- Click on the “Start measuring” button.
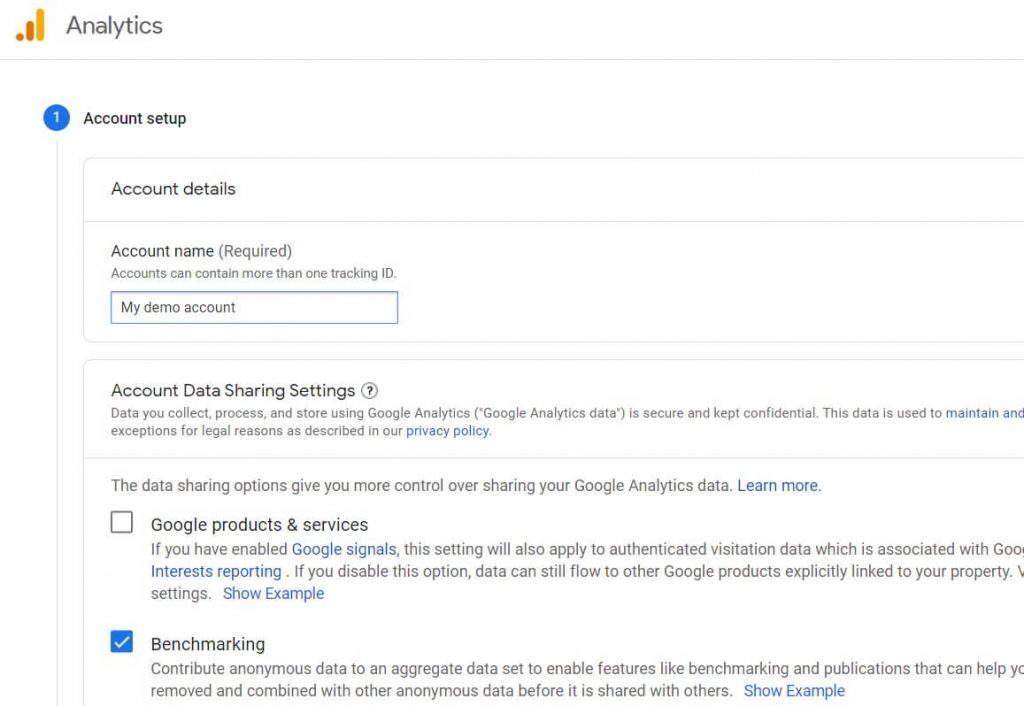
- Name your account.
- Add a property name (your site name).
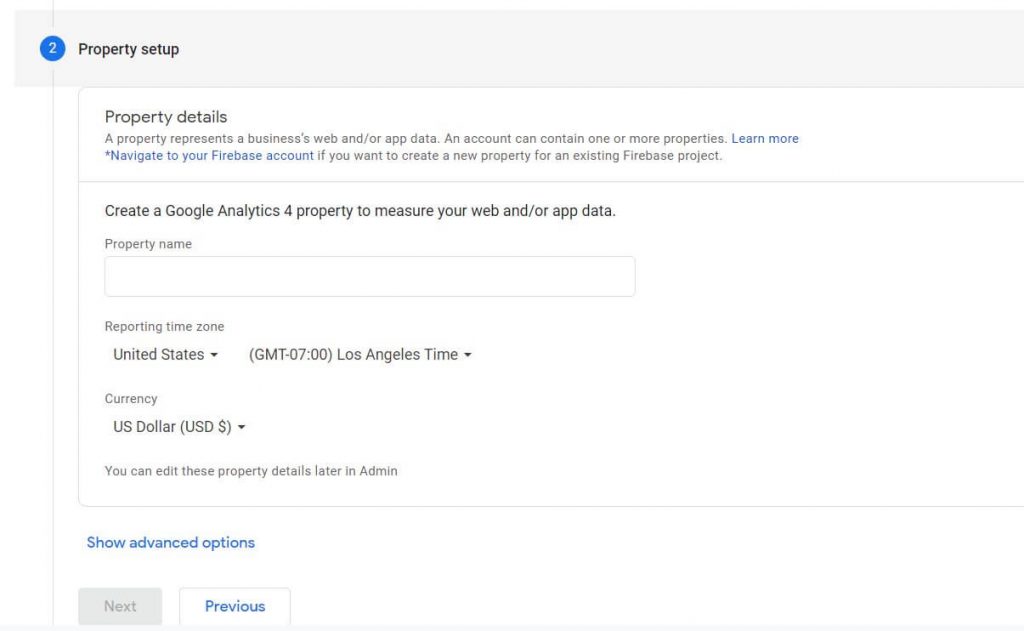
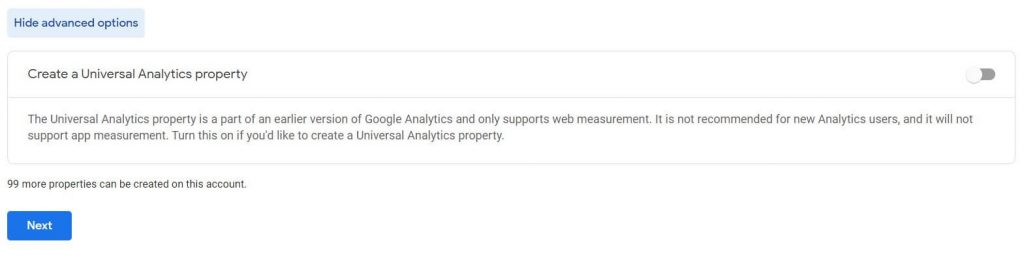
- From the Advanced Settings menu, turn on the toggle for creating a Universal Analytics property and enter the URL of your site into the field.
- Add business information and click on the “Next” button.
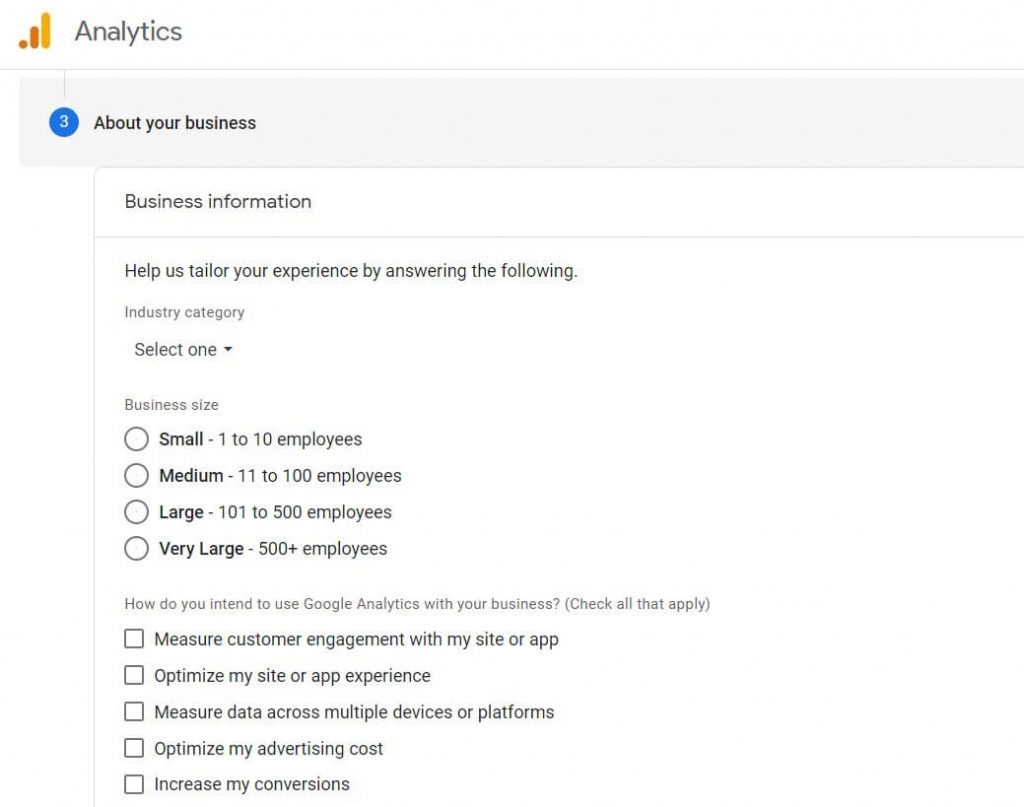
- Customize the terms of agreement and email communication options to your personal preferences.
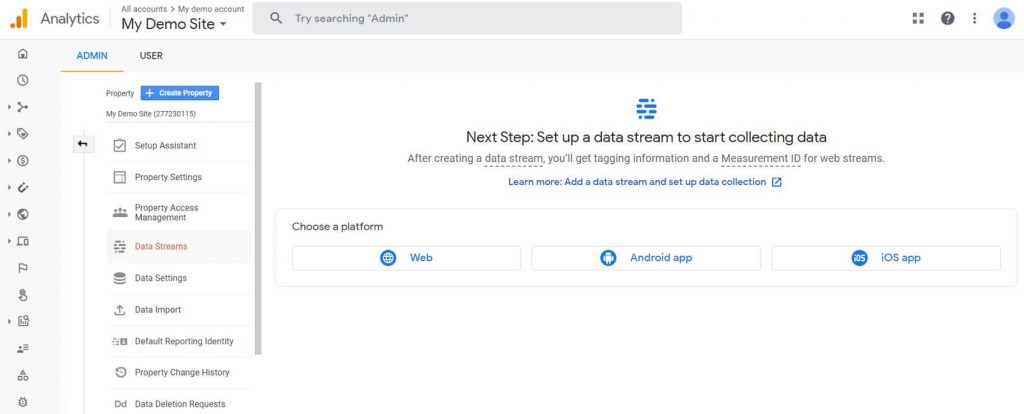
- Set up a data stream to start collecting data. Clicking on the “Web” button will take you to the web page where you can track your blog/website.
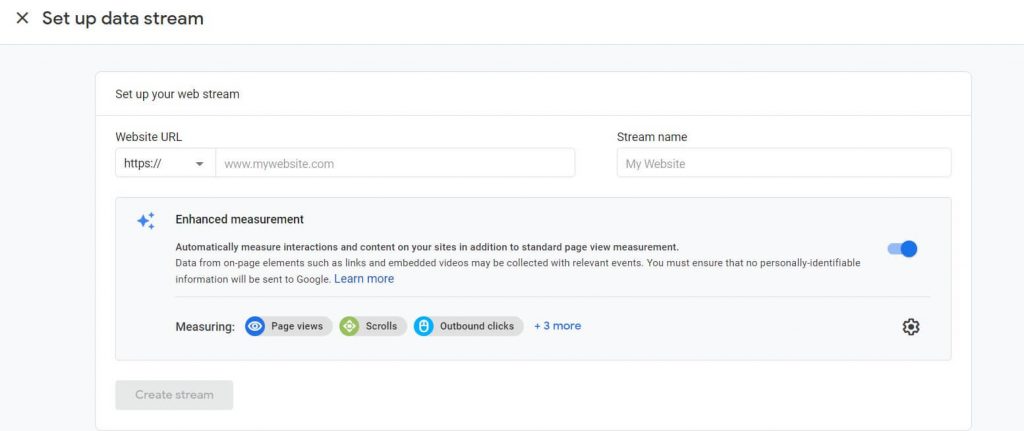
- Add the URL and name of your website.
After this step, we will send you a measurement ID that needs connecting to your site. This is a way to prove ownership of the site and tie it directly to Google Analytics, so that the entire system works properly.
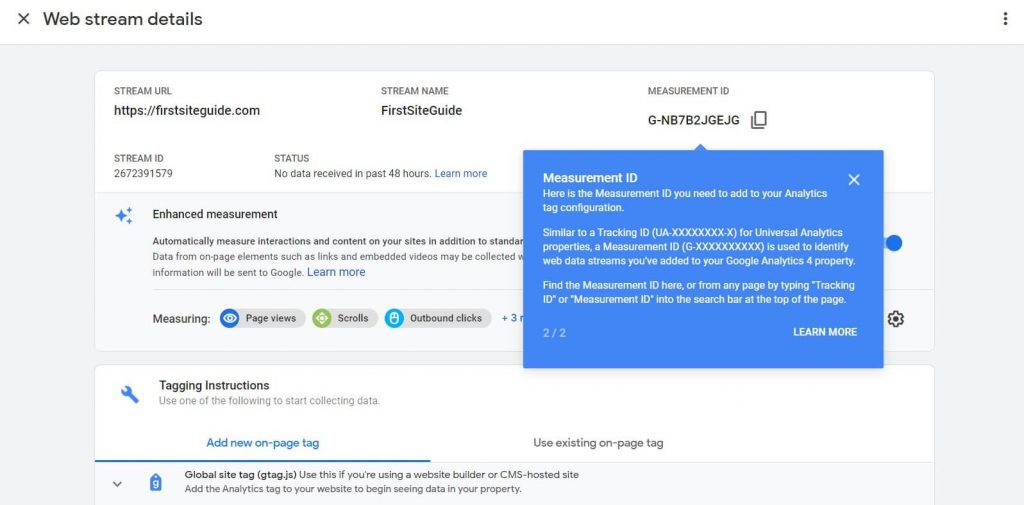
- Under Tagging Instructions, choose “Global site tag (gtag.js)” option.
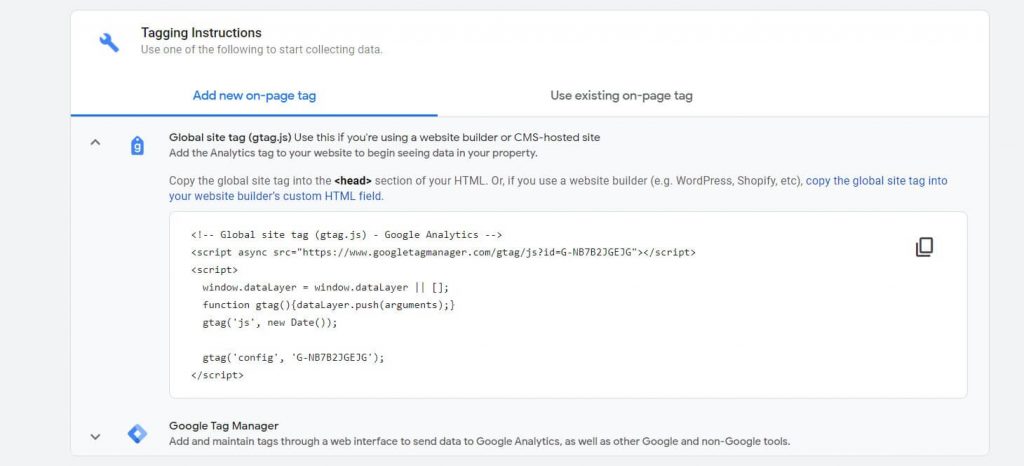
This will reveal a shortened URL containing your unique ID that I discussed earlier. Keep this window open, and choose one of the following ways to install the code: Add it manually, or use an easy-to-use WordPress plugin.
Add Google Analytics tracking code manually to your WordPress website
If you already know how to use WordPress and aren’t afraid of doing things yourself, adding the code manually isn’t too difficult.
However, before you start changing any WordPress files, I recommend making a full backup of your website, because even the slightest mistake could render your site completely unusable.
![]()
- Log in to your WordPress website.
- Navigate to Appearance -> Theme Editor.
- From the right-hand side of the screen, locate the “Theme Header” file (header.php) and click on it. This will load the code from the selected file.
- Copy the tracking code from Google Analytics.
- Paste the code right before the closing </head> tag.
- Update file.
Once you receive confirmation of a successfully updated app, you’re finished. You’ve successfully connected Google Analytics to your site, and now it’s time to start tracking your visitors. Usually, everything will be up and running in a few minutes, but don‘t worry if you still haven’t got the first stats within the first 24 hours after starting. It usually takes a few hours for the service to start functioning normally.
Add Google Analytics tracking code to your WordPress website using the plugin
You probably already know that WordPress comes with plugins that let you do practically anything. It’s no surprise that there are some great extension that allow you to connect Google Analytics in a better way. Instead of managing files and code directly, use a proven and streamlined user experience.
Here are some of the most popular Google Analytics Plugins for WordPress that you can install and use to connect to your site.
- MonsterInsights
- WP Google Analytics Events
- Analytify
- ExactMetrics
- Enhanced Ecommerce Google Analytics Plugin
- Google Analytics by 10Web
Here I will show you how you can set up the first one of the list, MonsterInsigths.
- Go to Plugins -> Add New.
- Search for “MonsterInsights”, a Plugin that has more than 3 million active users.
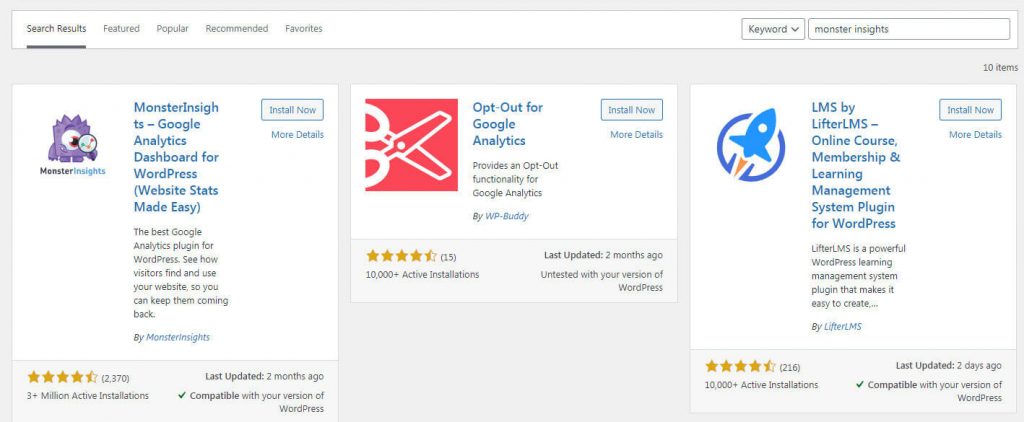
- Install and activate the plugin.
- Click on the “Launch the Wizard” button.
- Choose a category for your website.

- Click on the “Connect to MonsterInsights” button. This will open a new tab.

- Choose your Google account and log in.
- Click on the allow button to allow the plugin to access the necessary data.
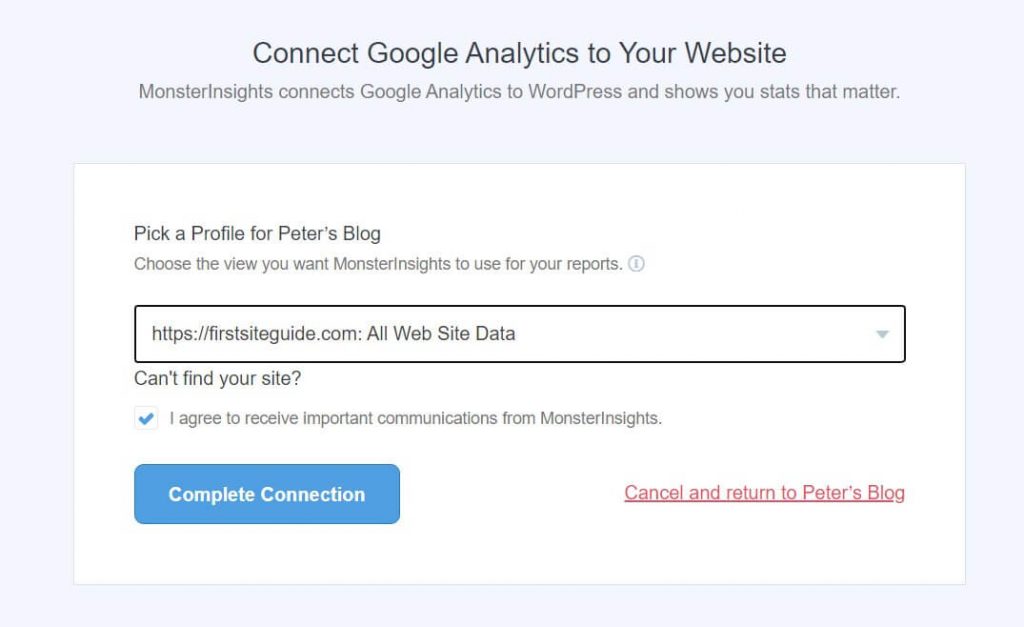
- Choose the site from your list, and click the “Complete Connection” button.
10. Wait for a few seconds for the setup to complete.
11. Go through options, and click on the “Save and continue” button.
12. Click on the button to finish the setup.
Clicking this link will take you back to where you were before you left. You’ve successfully integrated Google Analytics into your site, and you’ll be able to start tracking visitors within 24 hours.
The plugin will add a new menu item to your WordPress site, so that you can always access your reports and settings from the Insets menu item located on the Left-Side Menu.
Understanding the concept of the Google Analytics tool
Before the information is shown to you, Google Analytics uses the data to make it easier for the casual user to understand. Because of that, it’s important for you to know a few things.
Users vs sessions
The first important difference between users and sessions is whether they’re active or inactive. Users and sessions are not the same thing.
Users
Each user is an individual who uses your site from one device at a time. Every time someone visits your website, they will get a cookie – a small piece of code that records information about that visit. If this user returns to your site, he or she will be recognized as a returning visitor immediately. A new user who has not yet been assigned a cookie will appear as a new user.
However, note that the user accesses it using the same device. If the same person visits your site from a different smartphone or computer, the cookie won’t be visible, and that visitor will be treated as a completely new one. You can also quickly delete all cookies from the browser by opening the advanced settings and finding the “Clear browsing history” section where you will be able to easily delete “All cookies”. This action would make your account a new user for every site that you visit.
Sessions
A session is a specific period of time during which one user does something on your website. When the first page is opened by the user, the session begins, which means that Google Analytics starts tracking the visitor’s behavior. By understanding the user’s experience on your site, you can improve the user’s overall experience.
What was the first web page that the user opened after landing on our site? Where did they land next? What was the page that made them navigate away from your site? Those are just some examples of the answers collected from one session.
After the user has finished using your site, the session finishes. If the same user returns to your site within a few hours, days, or even weeks, this would be considered a new session. If the user isn’t counted as a new one if they’re accessing your site from the exact same device with the previous cookies available.
Pageviews vs events vs transactions
Before we get into the details about how Google Analytics works, let me briefly explain a few more things about how it works. Understanding users and sessions is important because it helps you understand pageviews, events, transactions, and their differences.
Pageviews – shows you the number and type of pages visitors open on your site. If the same person visits the same page one hundred time, that would be counted once as one hundred page views.
Events – A mark is something a user does on a site. Each event has to have been set up, but you may be able to track if people filled out the form, clicked the menu button, and so on.## Inputs
Transactions – An event that specifically tells you whether someone has completed an eCommerce transaction using your site.
You now know a little bit more than before about Google Analytics, and are ready to start using it.
Google Analytics overview
The first time you use Google Analytics, you may feel overwhelmed by the sheer volume of information available. Fortunately, the service continues to improve, and Google continues to make it easier for both beginners and professionals to get the most out of their search results.
You can access each of the tabs available in Google Analytics by clicking on the corresponding link at the top of the page.
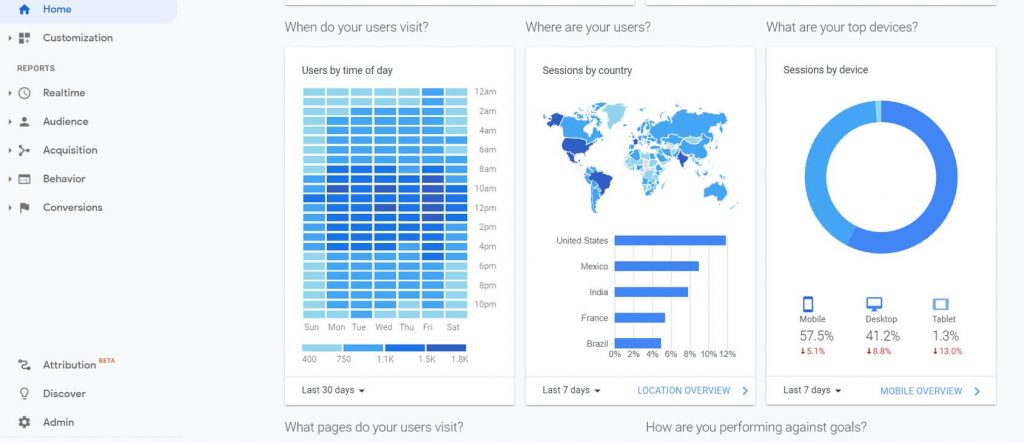
Home tab
The main dashboard, called the Home tab, holds most of the most important information for your website, including links to your social media profiles, analytics, and other features.
You will be able to access summarized information from other people who I will show you later in this course. If you want to see quickly whether a page has been indexed by Google, the home tab will display:
- Number of users and sessions, revenue, and conversion rates.
- Number of active users – those who are currently on your site.
- Graph showing you where your traffic comes from (direct, organic search, referral, social, and more).
- Breakdown of session by country.
- Time of day when users load your site.
- Most visited pages.
- And more.
Each widget has basic filtering options. For instance, you could quickly change the dates for the statistics and show the data from the last 30 days instead from the last 7 days.
If you want to read more about any specific topic, click the link in the lower-right hand corner of each widget.
Analytics Intelligence – search function
Instead of navigating through menus to find simple answers, google has introduced analytics intelligence – an AI tool that can understand your queries.
To start using it (Google Analytics), just find the search bar at your Google Analytics page. Type your question into the box, and let the service provide an answer.
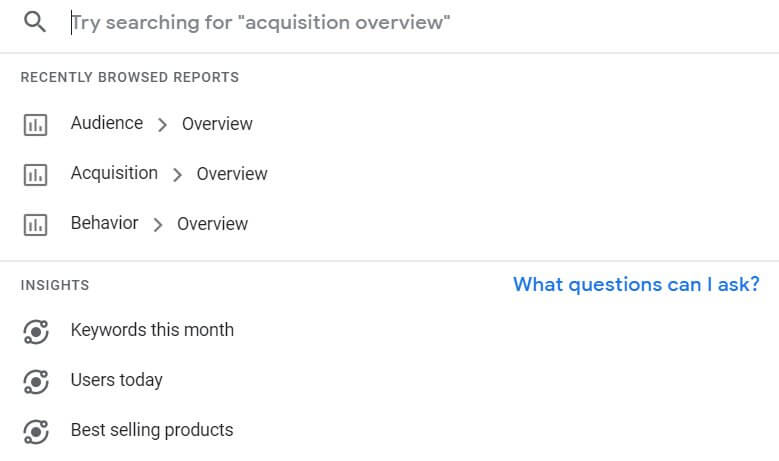
You can ask questions like:
- How many users did I have last week?
- What campaigns have the most sessions?
- Why did my user numbers change last week?
- And much more.
Customization
Once you start using GA regularly, you’ll realize that you don’t need all of the metrics displayed by default. You may also need some extra reports that normally require a few extra clicks to access.
You can create custom reports that only include the information that you really want.
For example, if your usual practice is to look at where visitors come from and how many unique visits they generate from each country, you could create a custom report that shows you just that information, and hides everything else that you don’t need to see.
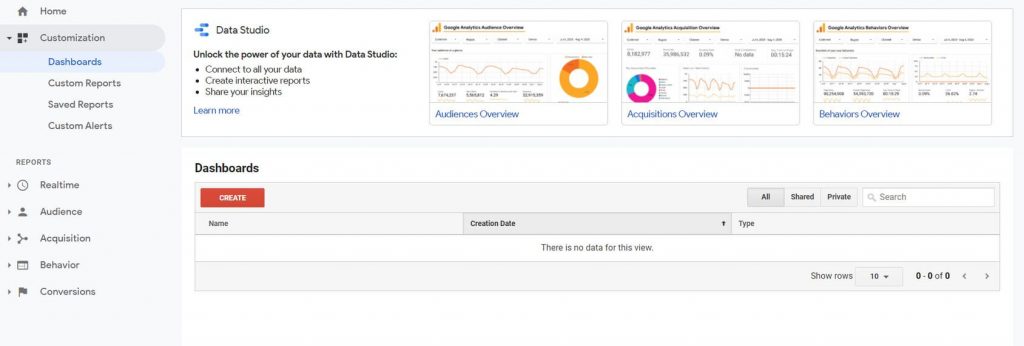
How to create a simple custom report in Google Analytics:
- Open your Google Analytics account.
- From the left-hand side menu, choose “Customization”.
- Click on “Custom Reports”.
- Choose “+ New Custom Report”.
- Name your report by adding the title.
- Choose metric groups that you want to show.
- Save changes.
You will now be able to access your custom reports at any time to view only the metrics you selected. You can create as many custom reports as you want, and customize them whenever you want.
Realtime reports
Most marketers and website owners need to see data that has been accumulating for weeks and sometimes months. However, there are times when you would like to see the visitors currently visiting your site. Here’s where the realtime reports will help you and show detailed information about users who are currently using your site.
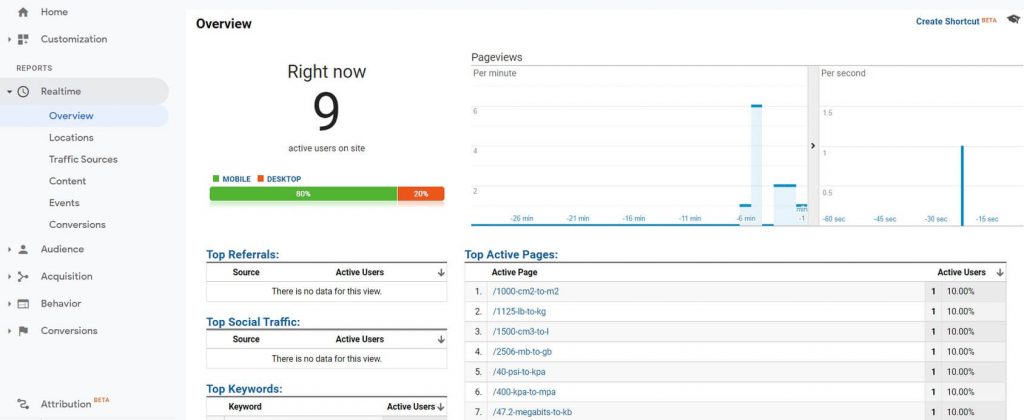
The realtime report will show you:
- Geographical locations – detailed graphs and an active map.
- Traffic sources – where the current users came from.
- Content – what pages are being opened, with their titles and URLs.
- Events – what events have been triggered by those users.
- Conversions – what goals have been achieved.
Audience
This report will give you all the information you need about your users and sessions from the time you installed the Google Analytics plugin. With the Realtime reports, you can see just the current users, but you can also filter the data to your specific needs and change the time period. This means that you could see how your users behave in the last month or last year, for example, if you were able to log into their accounts.
On the Overview tab, you’ll see the most important widgets that show you the number of users, session duration, bounce rate, countries they’ve come from, and more.
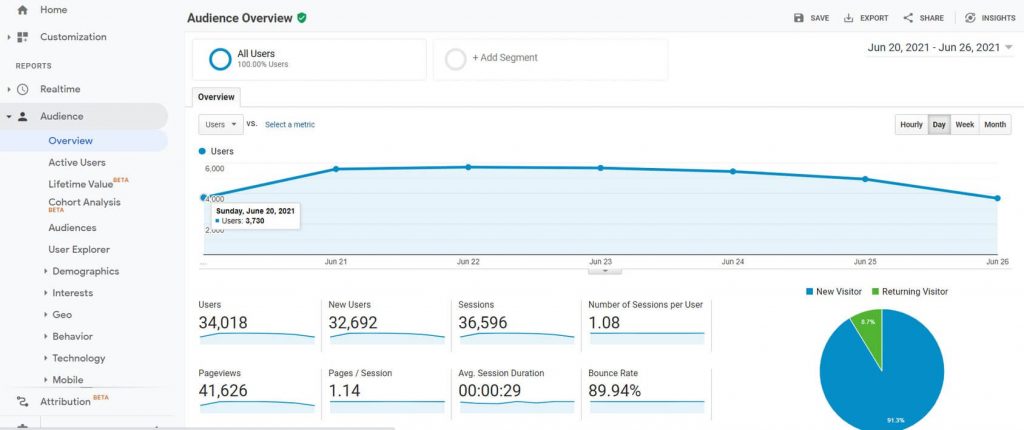
Here is a list that shows the key metrics you need to know in Google Analytics in order to be able read your daily reports. You can choose to view hourly, daily or weekly reports.
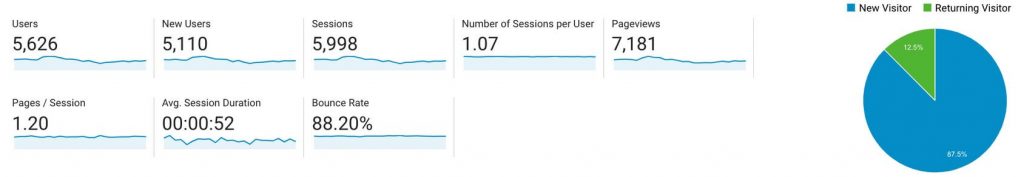
- Users – the number of people who visit your site.
- New Users – the number of people who have visited your site for the first time.
- Sessions – period of time a single user has spent on your site without leaving.
- Number of Sessions per User – how many sessions each user has had.
- Pageviews – the number of times a specific page has been viewed. If a single user visits a page a hundred times, each time counts as a new pageview.
- Pages / Session – the average number of pages viewed per one session.
- Avg. Session Duration – an average length of one session.
- Bounce Rate – the number of people who left your site after loading just one page.
If you move down the list, you will be able to access more info about:
- Active Users – users who have had at least one session in the given time period.
- Lifetime value – how much you have earned per user.
- Cohort Analysis – break down data into groups before analyzing.
- Audiences – all users and sessions.
- User Explorer – unique IDs that are assigned to specific user devices.
- Demographics – age and gender of the users.
- Interests – check the category a user belongs to such as shoppers, technology, media, beauty, etc.
- Geo – locations and language recognized on the device.
- Behaviour – how many users are new, how many returning, check their frequencies, and more.
- Technology – what operating systems, browsers, and networks the users are using.
- Mobile – check how many users have been accessing the site with desktop, mobile, and tablet devices.
- Cross Device – check to see if the same user has returned from a different device. You will need to activate Google signals for this feature to work.
- Benchmarking – monitor a specific report against the same report in a different time period to understand changes.
- User Flow – a detailed graph showing you how users navigate through your site.
How to detect the location of your website’s visitors in the last 30 days
Regardless of which type of website you’re running, you will want some way of knowing where your visitors are coming form. It’s especially true when you’re selling something.
- Open your Google Analytics account.
- Navigate to Audience -> Geo -> Location.
- Click on the date in the upper-right corner of the screen.
- Change “Date Range” to “Last 30 Days”.
Acquisition
Find out more about the ways people found your site and navigigated to it. There are differences between entering the URL directly, finding a site by searching for it using a search engine, and those that come through other websites or social media sites.
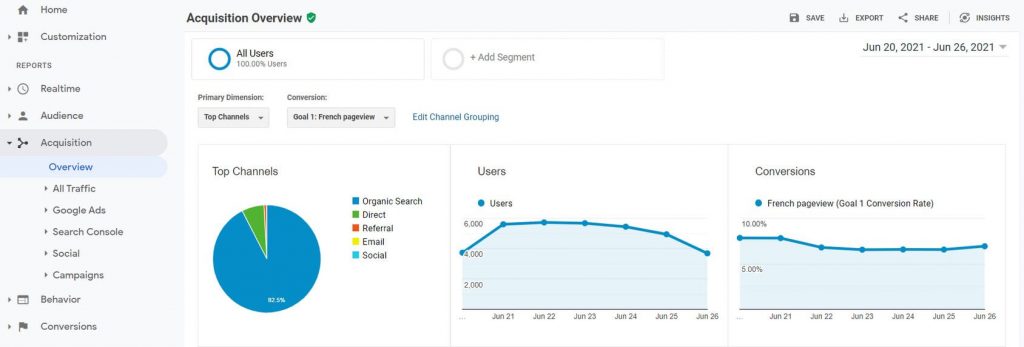
The Acquisition Report can also help you with information about Google Ads (if they’re connected) as well as information about the Google Search Console if you’re using it.
- All Traffic – view channels, treemaps, source/medium, and referrals.
- Google Ads – access the analytics for your Google Ads campaigns.
- Search Console – view landing pages, countries, devices, and specific keywords users have used to access your website.
- Social – get more info about users who came from social media sites.
- Campaigns – receive info about paid and organic keywords, as well as access to cost analysis.
How to check the number of visitors coming from Google
It’s important to understand how many people have found you through Google because Google is the biggest search platform.
- Open your Google Analytics account.
- Go to Acquisition -> All Traffic -> Source/Medium.
- Click on Google/organic.
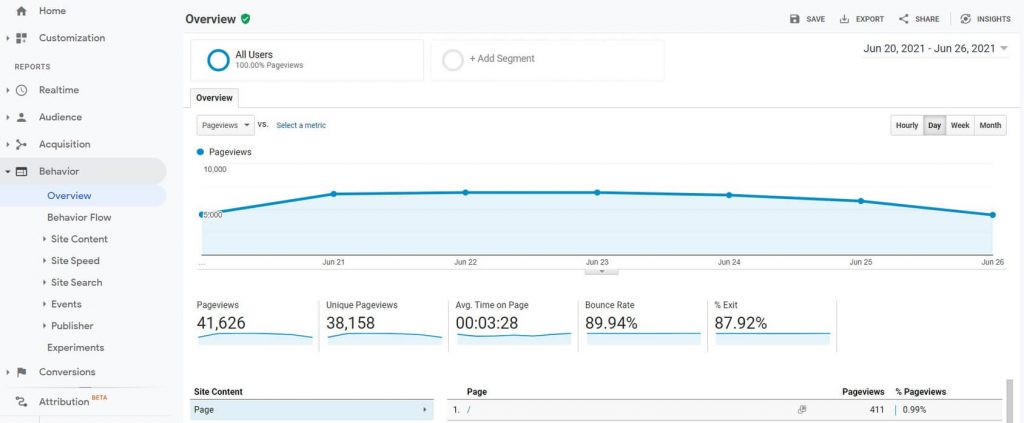
Behavior
Reports from Google Analytics and similar tools help you understand who visits your site, where they come from, and how they got there. It’s now time to learn more about content, speed of your website, events, and more.
- Behavior Flow – access a detailed graph that will show you how users navigate through your website.
- Site Content – find out the most and least visited pages on your site.
- Site Speed – understand how well your pages behave in specific browsers.
- Site Search – discover how people are using the search on your site.
- Events – examine how many people triggered specific events you have created.
- Publisher – link AdSense or Ad Exchange with Google Analytics to get more info about impressions, clicks, and revenue.
How to find out the most visited page on your site
To understand what your visitors want from your site, you need to determine which page they’re visiting most often. This will allow you to improve the content, and tailor it to your audience’s needs.
- Go to your Google Analytics account and log in.
- Navigate to Behaviour -> Site Content -> All Pages.
- Click on the “Unique Pageviews” column to sort pages.
Conversions
When you open the Conversion report, you will understand exactly what people do on your site.
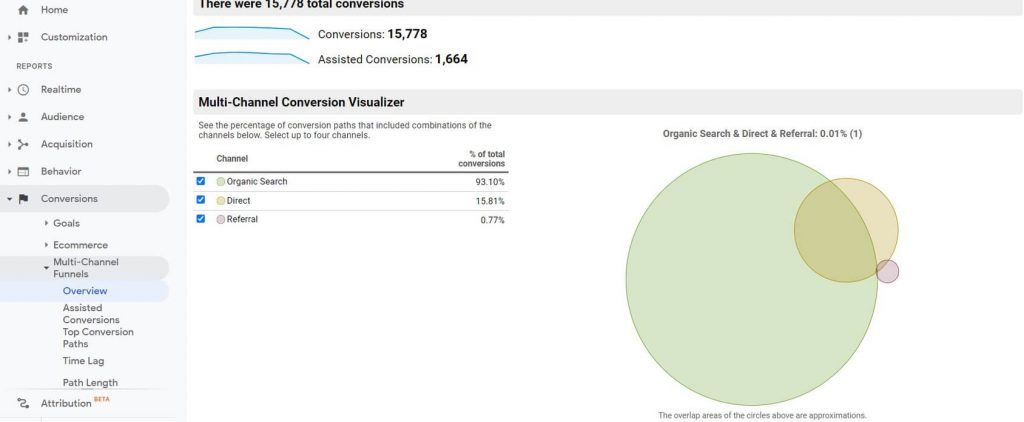
Actions are conversions that you want people to take on your website. It consists of the following:
- Goals – shows you goals that you have achieved (and set up earlier).
- Ecommerce – needs to be set up separately. If so, it will show you how many transactions have been completed through your site/app.
- Multi-Channel Funnels – see the percentage of conversion paths that include combinations of the channels.
Conclusion
Analytics reports give you the opportunity to learn more about your traffic, your audience, and even your competitors. You can use this knowledge to improve your marketing strategy and optimize your business.
Please note that these are only some of the things you can do with Google Analytics. There are thousands of other features available.

0 Comments